
Hard, Soft, Or No Landing Ahead?
Regional Bank Failures
It’s been a volatile few weeks of trading in US equities, with the recent failure of Silicon Valley Bank and Signature Bank prompting sell-offs in the financial sector, followed by strong counter-trend rallies as these areas of the US stock market have become highly oversold.
Looking at the financial sector in isolation, we see a spike down from the 100-week, to the 200-week moving average, a more than 12% drop in less than a fortnight. This has been followed by buying at the lows and an attempt to find support at this crucial level.
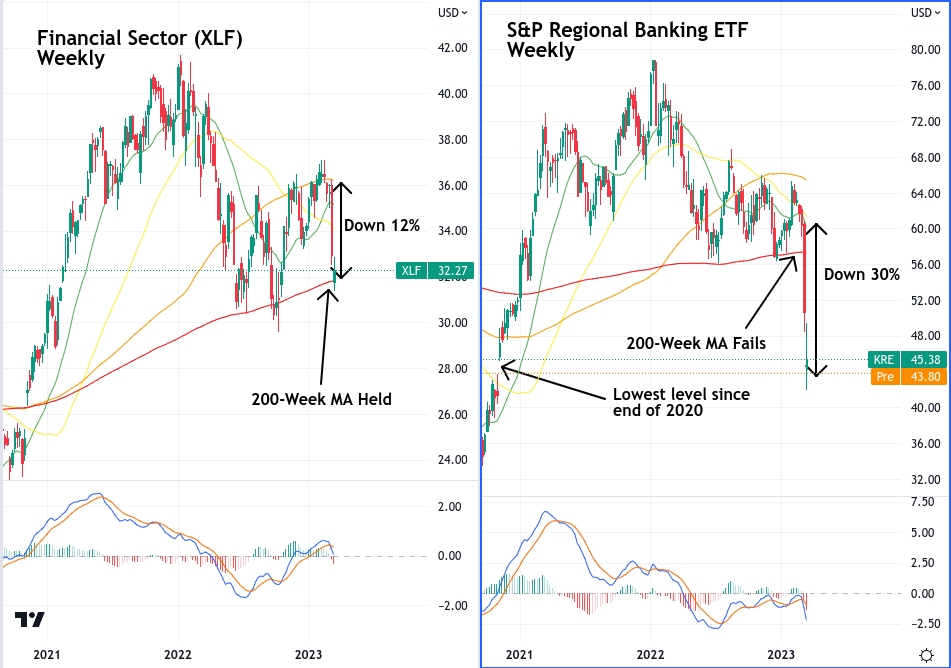
Looking specifically at regional bank stocks, we get a truer sense of the extent of the damage that’s been done. S&P’s Regional Bank ETF was down, peak-to-trough, over 30% since the second week of March. The sell-off caused the ETF to crash through its 200-week moving average and actually took regional bank stocks down to their lowest level since the end of 2020.
US Treasury Steps In
While there’s still a distinct lack of confidence in the financial sector in general, and regional banks specifically, the news that the US government would step in to protect depositors has been received as a positive by the markets, with the S&P 500 up more than 3% from its weekly lows, and the Nasdaq 100 up over 4% from its own weekly lows.
Crypto has also been a big beneficiary of recent headlines, with Bitcoin up more than 12% on the week, and the broader crypto market up over 7%.
At least in the short-term, market participants appear to be regarding these bank failures as evidence that the Federal Reserve’s unflinchingly hawkish stance is starting to break things in the broader economy. The expectation is that this will inevitably lead to the Fed being forced to pivot back to a dovish monetary stance, in order to prevent further dislocations in the economy.
CPI Underwhelms, But Inflation Remains Elevated
The recent CPI print, while showing that inflation is still an issue, provided no major surprises. Month-over-month consumer prices came in at 0.4%, as expected by Wall Street. The year-over-year picture was the same, with an anticipated 6% figure showing that inflation has dropped since the last report’s 6.4% reading.
If there was a surprise, it was core CPI coming in marginally higher than expected at 0.5% month-over-month, to the market’s expectations of a 0.4% print. While Jerome Powell’s preferred measure, PCE excluding energy and shelter, won’t be released until after the next FOMC meeting, its CPI equivalent was up by 6.2% month-over-month, a six-month high.
Rate Uncertainty Returns
The Fed Chair’s recent testimony before congress had the effect of convincing the market that it would be steadfast in its commitment to higher for longer, and that perhaps even a re-acceleration of rate hikes back to 50 basis points was still on the table.
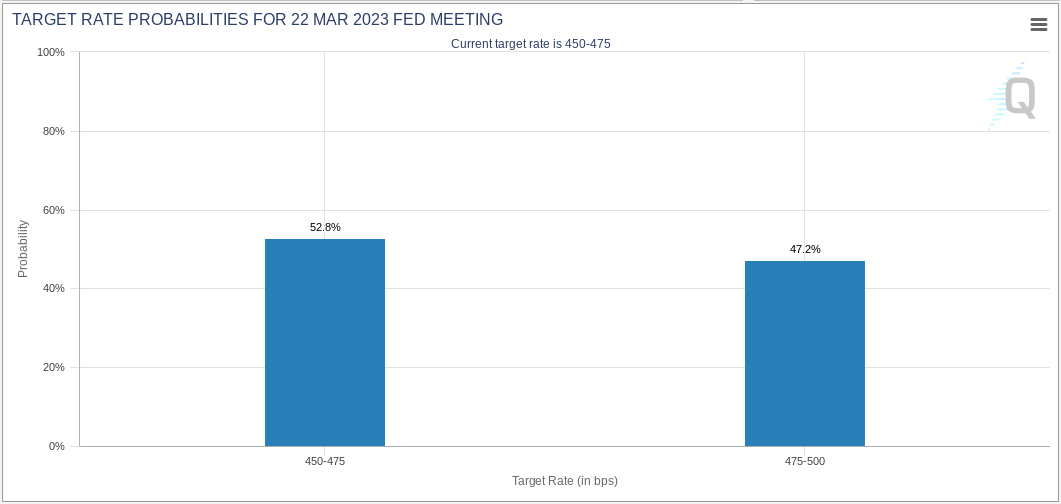
As the news of SVB’s collapse has circulated, expectations of the Fed’s terminal rate have fallen by more than a percent from 5% on Friday March 10, to 3.84% the following week. The CME’s FedWatch tool is extremely volatile at present. In the space of several hours it has gone from assigning an over 80% probability of a further 25 basis point hike at the upcoming March 22 FOMC meeting, to a 49% chance of a pause, to now a 52.8% chance of a pause.
US Stocks. Long-Term Technical View
January’s equity breakout took the S&P 500 above a long-standing line of diagonal resistance, going all the way back to the peak of December 2021. The recent bounce from the 3800 level also coincides with the index appearing to find support on this same diagonal line. The break above bear market resistance is adding fuel to the bull case that US equities did in fact bottom-out in October of 2022, and that what we’ve seen recently is a weekly higher-high at 4130 in January and a higher-low at 3860 this month.
This bull case has yet to be reflected in the positioning of HYCM clients, for whom the S&P 500 was only the 9th most traded asset in 2022. Perhaps this is due to a pervading concern that further downside is in store.
When you look at previous bear markets in recent years, you notice that breaking above diagonal resistance before continuation to new lows is not out of the ordinary. We see a similar pattern both in the early days of the GFC in 2007-2008, and in the Dotcom bust in 2000-2001.
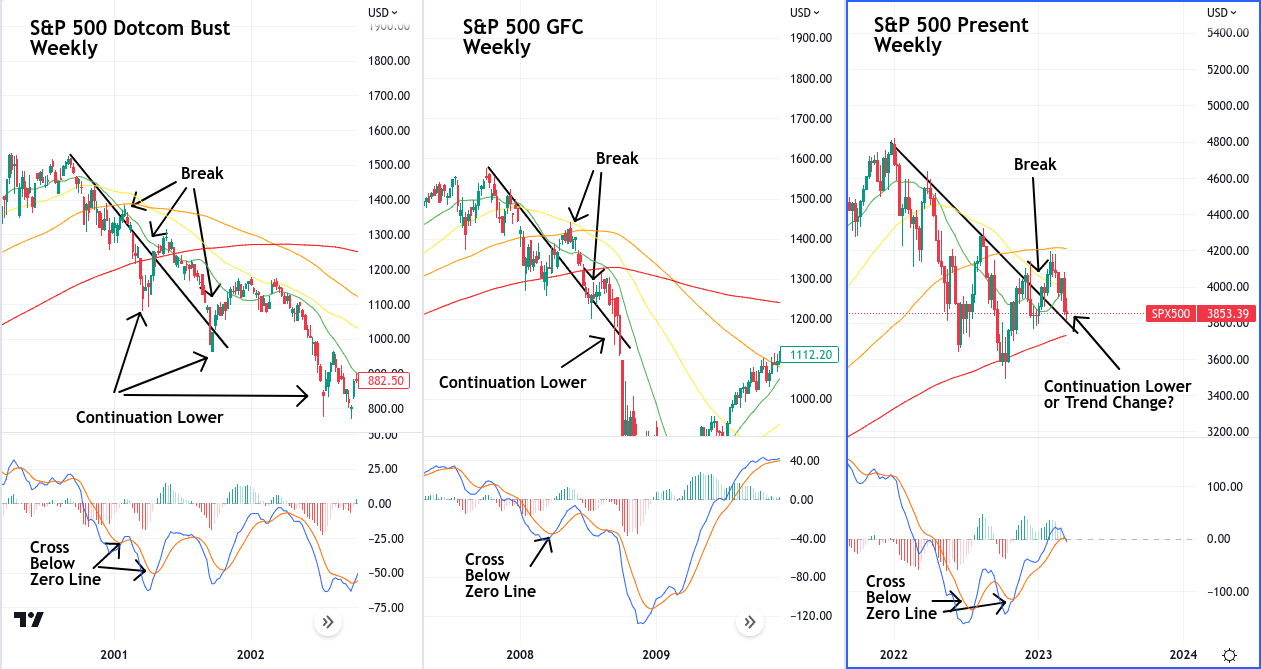
During the GFC, the S&P 500 broke above diagonal resistance in April of 2008, it then met the same line as support in June, and finally broke down below it in September.
Back in 2001, we saw a similar pattern. During that particular bear market, the price broke resistance twice. Once in January of 2001, and once again in April of the same year. On both occasions the rally failed, and the underlying downtrend resumed.
Notably, on both occasions, the bullish cross of the MACD signal lines that accompanied the bullish action occurred below the zero line.
Turning to the current picture, we see more of the same. The MACD signal line crosses bullish in October (below the zero line), the price breaks downward-sloping diagonal support in January, and now appears to be retesting the line from above. The MACD signal line has popped above zero for the first time since February of last year, but it currently appears to be crossing bearish once more and heading back down below zero.
Also, keep in mind that the continuation of the bearish trend in 2001 and 2008, both occurred significantly below the 200-week moving averages, whereas the S&P 500 has only currently tested this line of support once, and has thus far managed to stay above it.
Technically, a soft- or no-landing scenario likely has this line of support holding. An extended break below it, if in store, is more likely to be the case in the event of a hard landing, which would necessarily mean a more protracted recessionary downturn.
Trade with HYCM
About: HYCM is the global brand name of HYCM Capital Markets (UK) Limited, HYCM (Europe) Ltd, HYCM Capital Markets (DIFC) Ltd, HYCM Ltd, and HYCM Limited, all individual entities under HYCM Capital Markets Group, a global corporation operating in Asia, Europe, and the Middle East.
High-Risk Investment Warning: Contracts for Difference (‘CFDs’) are complex financial products that are traded on margin. Trading CFDs carries a high degree of risk. It is possible to lose all your capital. These products may not be suitable for everyone and you should ensure that you understand the risks involved. Seek independent expert advice if necessary and speculate only with funds that you can afford to lose. Please think carefully whether such trading suits you, taking into consideration all the relevant circumstances as well as your personal resources. We do not recommend clients posting their entire account balance to meet margin requirements. Clients can minimise their level of exposure by requesting a change in leverage limit. For more information please refer to HYCM’s Risk Disclosure.
*Any opinions made in this material are personal to the author and do not reflect the opinion of HYCM. This material is considered a marketing communication and should not be construed as containing investment advice or an investment recommendation, or an offer of or solicitation for any transactions in financial instruments. Past performance is not a guarantee of or prediction of future performance. HYCM does not take into account your personal investment objectives or financial situation. HYCM makes no representation and assumes no liability as to the accuracy or completeness of the information provided, nor any loss arising from any investment based on a recommendation, forecast, or other information supplied by an employee of HYCM, a third party, or otherwise.